How instrument frequency response analysis reveals phase interference
Phase interference is rarely visible in a simple frequency-response trace. Two systems can show a broadly acceptable magnitude response while producing unstable tone, weak low-frequency output, blurred stereo imaging, or inconsistent pickup balance because their phase relationships are wrong. Instrument frequency response analysis becomes more diagnostic when amplitude, phase, time delay, and coherence are interpreted together rather than treated as separate measurements.
The central question is not whether a device reproduces every frequency at the same level. It is whether the signal components that should combine constructively arrive with compatible timing and polarity across the intended operating band. Where they do not, the result is interference: some frequencies reinforce, others cancel, and the audible character changes with position, level, routing, or configuration.
Why amplitude response alone can conceal the problem
A conventional magnitude plot shows output level versus frequency. It can reveal obvious peaks, roll-off, resonances, and notches, but it does not explain the timing relationship between the spectral components that created those features. A deep notch may be caused by a cabinet resonance, a microphone placement effect, a crossover misalignment, a parallel DSP path, or destructive summation between two transducers. Those mechanisms require different corrective actions.
Phase response expresses angular displacement at each frequency relative to a reference. A phase trace that changes smoothly may reflect a simple propagation delay or a minimum-phase filter behavior. Abrupt rotations, irregular wrapping, or departures between channels can indicate resonances, filtering interactions, polarity errors, or measurement contamination. The most useful interpretation usually comes from comparing phase with group delay, impulse response, and coherence.
For two equal-amplitude sinusoidal signals, a 180-degree phase difference produces theoretical cancellation. In practical electroacoustic systems, the relationship is frequency dependent. A fixed time offset creates a phase difference that increases with frequency:
Phase shift = 360° × frequency × time delay.
A delay of 1 ms corresponds to 36 degrees at 100 Hz, 180 degrees at 500 Hz, and one full cycle at 1 kHz. This is why a timing error that appears harmless in a low-frequency measurement can create repeated comb-filter notches across the midrange and high frequencies. It also explains why alignment cannot be judged by matching one frequency point alone.
Magnitude response remains essential, but its value lies in correlation. A repeating notch pattern in amplitude response, accompanied by phase divergence between two transfer functions, is strong evidence of path interference. A narrow response anomaly with a steep local phase rotation may instead point to a mechanical or acoustic resonance. The distinction determines whether the remedy is delay adjustment, crossover redesign, damping, repositioning, or a change in signal routing.
Where phase interference enters an instrument signal chain
The term “instrument” can refer to an acoustic instrument under microphone measurement, an electric instrument with magnetic or piezo pickups, or an integrated electroacoustic product containing transducers, preamplifiers, DSP, amplification, and loudspeakers. In each case, phase interference can arise before the signal reaches the main sound system.
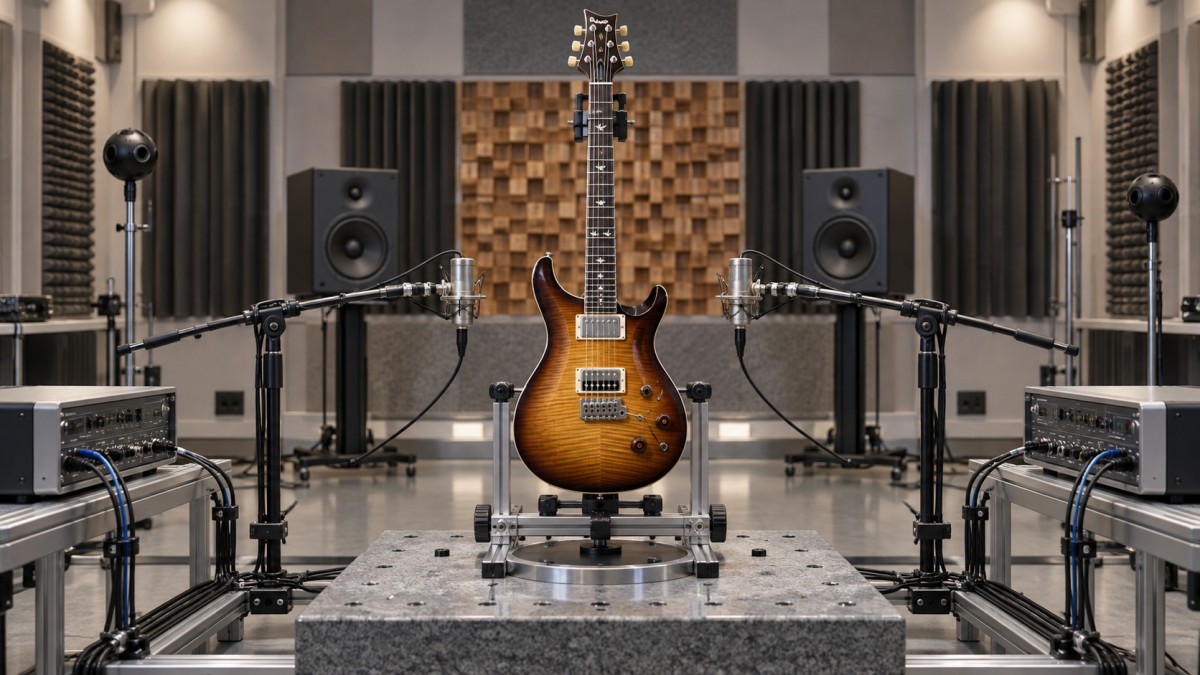
On electric guitars and basses, multiple pickups are a familiar source. Combining neck and bridge pickups does not simply add two tonal signatures. The pickups sample string motion at different positions, so they capture different phase relationships along the vibrating string. Parallel combination can create characteristic frequency cancellations, which form part of the recognizable “in-between” sound on many multi-pickup instruments. That behavior is not automatically a defect. It becomes a technical concern when the cancellation pattern changes unexpectedly between units, when switching options lose level excessively, or when active electronics and cable capacitance shift the intended response.
Piezo-equipped instruments introduce another set of variables. Individual bridge elements can differ in sensitivity, mechanical coupling, and resonance. When their outputs are summed, unequal phase or timing behavior may produce uneven string-to-string articulation or a brittle region in the upper midrange. A frequency response measured only from the mixed output can identify that a problem exists, but channel-by-channel transfer functions are required to locate the contributing element.
Microphone systems create interference whenever more than one capture path reaches the mix. Two microphones on an acoustic guitar, a close microphone combined with a pickup, or a vocal microphone mixed with a stage ambience channel all introduce path-length differences. The cancellation pattern changes when the performer moves, when the microphone spacing changes, or when one channel is processed with latency. Equalization cannot reliably correct a moving comb filter because the null frequencies are determined by relative arrival time, not by a stable spectral imbalance.
In amplified instruments and compact electroacoustic products, interference may occur between direct radiation from a driver and cabinet ports, between a woofer and tweeter around a crossover region, or between a main loudspeaker and a secondary monitor. A low-frequency port contribution is intentionally delayed by its acoustic behavior; that delay is part of the enclosure design. The issue is whether the port, driver, filter, and enclosure interactions produce the intended summation under the specified measurement conditions.
The measurement chain must be more stable than the suspected fault
Phase analysis is unusually sensitive to test setup errors. A technically valid conclusion requires a stable reference, repeatable geometry, and an acquisition method suited to the device. Without those controls, the measurement may describe the room, fixture, cable routing, or software configuration rather than the instrument.
A transfer-function measurement using a known reference signal and dual-channel acquisition is generally preferable for diagnosing phase relationships. The reference channel records the excitation signal; the measurement channel records the device response. Modern analyzers can derive magnitude, phase, impulse response, coherence, and delay from swept-sine, periodic-noise, or other suitable excitation methods. The choice should reflect the device’s linearity, noise floor, and operating conditions.
For acoustic measurements, microphone position is not a minor detail. Moving a microphone by a small fraction of a wavelength can alter the measured high-frequency phase substantially. The effect becomes particularly severe when measuring directional instruments, loudspeaker cabinets, or multi-driver systems. Mechanical positioning, fixed reference distances, and documented axis definitions are necessary if results are to be compared between prototypes or production samples.
Room reflections complicate phase interpretation. A reflection arriving shortly after the direct sound can produce comb filtering that resembles an equipment defect. Time-windowing can isolate the direct arrival, but the window limits low-frequency resolution: a shorter window suppresses reflections more effectively while reducing the ability to resolve long-wavelength behavior. Near-field techniques, ground-plane measurements, gated measurements, and low-frequency merge procedures each have valid roles, but they should not be mixed without documenting the crossover and reference assumptions.
Electrical measurements require comparable discipline. An instrument pickup, preamp, amplifier input, or passive tone network may be highly sensitive to source and load impedance. A response measured through a low-impedance analyzer input can differ materially from the response obtained when connected to the intended amplifier or wireless transmitter. The test report should state the source impedance, load impedance, cable capacitance where relevant, level, gain state, EQ state, and power condition. Otherwise, phase and magnitude comparisons between products may be misleading.
Reading the evidence: delay, phase, group delay, and coherence
Raw phase plots can be difficult to read because phase wraps by 360 degrees. Unwrapping may reveal the underlying slope, but a steep line is not automatically a problem. A uniform slope often represents pure delay: the entire signal has been shifted in time without frequency-selective distortion. In a loudspeaker measurement, that delay may simply include the acoustic flight time from source to microphone. In a digital signal chain, it may represent converter and processing latency.
What matters is relative delay between paths that will be summed. If a direct pickup output is blended with a microphone signal, their individual absolute delays are less important than the delay difference at the summing point. The same principle applies to a woofer and high-frequency driver, two pickup coils, or two redundant processing routes.
Group delay is often more intuitive because it describes how delay varies with frequency. It is derived from the slope of phase with respect to angular frequency. Broad, smooth group-delay behavior can be an expected consequence of filters and resonant systems. A localized increase may identify energy storage around a resonance, a bass-reflex tuning region, a high-order crossover, or a strong all-pass characteristic. It should not be evaluated as a standalone quality score. The relevant question is whether the delay behavior is compatible with the intended transient response and with adjacent signal paths.
Coherence indicates how reliably the measured output is related to the reference at each frequency. Low coherence can result from noise, distortion, time variation, reflections, insufficient excitation level, or an unstable device. Phase values in regions of poor coherence should not be used to set alignment delays or declare a cancellation mechanism. An attractive-looking phase trace is not trustworthy if the signal-to-noise ratio and measurement repeatability are inadequate.
Impulse and step responses provide a complementary time-domain view. Separate arrivals can expose a delayed secondary path that is not obvious in a smoothed frequency plot. For crossover systems, the relative timing of driver arrivals and the shape of the combined impulse response can help test whether filter choices and physical offsets are working together. However, a single impulse response does not establish performance over every listening angle. Multi-driver devices require off-axis as well as on-axis interpretation because phase alignment that appears correct on one axis may degrade elsewhere.
Distinguishing intended tonal behavior from an engineering fault
Not every cancellation is a defect. A multi-pickup instrument may be deliberately voiced through partial cancellation. A directional microphone relies on phase differences between ports to create its polar pattern. A crossover network necessarily changes phase around its transition band. A loudspeaker enclosure may use resonant behavior to extend low-frequency output. The evaluation task is to determine whether the measured interference is controlled, repeatable, and appropriate to the intended function.
Three questions are more useful than asking whether a phase curve is “flat.”
- Is the behavior repeatable? A feature that changes with cable, power-up state, level, or minor fixture movement may indicate an uncontrolled interaction.
- Does it match the design mechanism? A planned crossover region should show the expected relative driver behavior. An unexplained notch far from that region deserves investigation.
- Does summation remain stable under realistic configurations? A response that works only in one switch position, at one microphone distance, or with one DSP preset is not necessarily robust in use.
Production validation should therefore compare more than a single averaged amplitude trace. Channel matching, polarity verification, delay consistency, preset-dependent response, and repeatability after assembly changes are relevant where the product combines multiple sources. For a pickup system, this may mean measuring each pickup and each switch combination. For an active acoustic instrument, it may include direct output, balanced output, wireless feed, and any blended microphone path. For a compact PA product, it includes individual drivers, summed response, and processing modes.
Common corrective actions—and when they fail
Polarity reversal is the fastest test for a suspected 180-degree inversion, but it is not a universal phase correction. Reversing polarity changes the sign of the waveform at all frequencies. It can improve summation near one region while worsening it elsewhere if the underlying issue is frequency-dependent delay, a filter phase characteristic, or geometric offset.
Delay adjustment is appropriate when two paths are substantially similar but arrive at different times. Digital alignment can be highly effective for blending a pickup with a microphone, aligning loudspeaker drivers, or synchronizing parallel processing paths. The target should be verified over the operating bandwidth, not chosen solely by maximizing one response peak. A delay that creates a strong on-axis sum may still produce poor off-axis behavior or unstable results when the source moves.
Equalization is often misapplied to phase interference. EQ can reduce the audibility of a peak or compensate a broad tonal trend, but it cannot restore energy at a true cancellation null created by two opposing paths. Boosting a notch may increase amplifier demand, driver excursion, or noise without producing the expected acoustic correction. Removing one contributing path, changing geometry, correcting timing, or modifying the crossover is usually more effective.
All-pass filters can alter phase with limited magnitude change and can be useful in controlled crossover or system-alignment work. Their use requires restraint. They introduce frequency-dependent delay and can complicate transient behavior. An all-pass section should solve an identified alignment problem supported by transfer-function evidence, not be added merely because a phase trace appears visually irregular.
What a defensible technical report should contain
There is no universal acceptance limit for phase response across all musical instruments and electroacoustic products. Requirements depend on topology, intended voicing, measurement environment, and use case. Standards in the IEC 60268 series provide relevant measurement frameworks for categories of sound-system equipment, but they do not replace product-specific engineering criteria, especially for hybrid instruments and proprietary DSP architectures.
A useful report makes its method auditable. It identifies the device configuration, stimulus, acquisition channels, sampling rate, smoothing, frequency range, microphone model and position where applicable, gating or windowing method, environmental conditions, load conditions, and any delay reference used. It should present unsmoothed or lightly processed evidence where narrow interference features matter, while clearly labeling any smoothing used for communication.
The report should also separate observation from interpretation. “A 6 dB notch appears near the crossover region” is an observation. “The notch is caused by driver misalignment” is a hypothesis that should be tested by individual-driver measurements, polarity checks, delay variation, and repeatability checks. That distinction prevents a visually persuasive graph from becoming an unsupported root-cause conclusion.
Instrument frequency response analysis reveals phase interference when it treats sound as a time-dependent system rather than a static curve. The most reliable evaluation combines magnitude response with relative phase, group delay, coherence, impulse behavior, and controlled test conditions. That combination makes it possible to distinguish intentional voicing from uncontrolled cancellation—and to select a correction that addresses the actual mechanism rather than its visible symptom.
Related Intelligence
 Touring CAPEX & Acoustic ROIOct 28, 2026How do off days affect touring AV rental costs on multi-city tours?Touring AV rental costs can continue on off days. Discover how hold rates, crew, and transport affect multi-city tour budgets—and compare smarter options before booking.
 Touring CAPEX & Acoustic ROIOct 28, 2026NAMM and Bass Magazine Announce Inaugural Awards Ceremony at 2026 NAMM ShowNAMM and Bass Magazine announce the inaugural Bass Magazine Awards at the 2026 NAMM Show. Discover how the event will bring bassists, instrument makers and audio suppliers together.
 Touring CAPEX & Acoustic ROIOct 27, 2026How to compare live sound technology provider quotes for a tourCompare live sound technology provider quotes with confidence. Uncover hidden costs, assess crew and backup support, and choose the right tour package before you sign.
 Broadband Acoustic PanelsOct 26, 2026How does panel thickness affect the price of acoustic materials?Explore how panel thickness affects acoustic materials price. Compare absorption, shipping, and installation costs to choose the right panels and avoid paying for unnecessary depth.
 Digital Live Mixing ConsolesOct 26, 2026DiGiCo Launches Quantum638 Digital Mixing Console and Quantum638T Theatre VersionExplore DiGiCo Quantum638 and Quantum638T digital mixing consoles for live sound and theatre. Discover what buyers should verify to choose the right model for their next project.
 Active DSP Line ArraysOct 25, 2026How line array aiming affects live sound coverage for theatersImprove live sound coverage for theaters with smarter line array aiming. Discover how tilt, splay, and trim height help deliver clearer dialogue and more consistent sound across seats.
 CE/FCC & CITES Wood RegsOct 25, 2026EU CITES Appendix D Adds Meranti and Sapele to Import MonitoringEU CITES Appendix D reportedly adds Meranti and Sapele to import monitoring from June 29, 2026. Explore notification requirements and compliance priorities for EU-bound timber.
 5-Axis CNC Tonewood CarvingOct 24, 2026How to reduce tear-out in CNC tonewood processing of guitar topsReduce tear-out in CNC tonewood processing of guitar tops. Discover practical tooling, chip load, and workholding tips to achieve cleaner cuts, protect soundboards, and reduce costly scrap.
 Active DSP Line ArraysOct 24, 2026Metinteractive Rebuilds Bethel Woods Lawn Sound SystemMetinteractive rebuilds the Bethel Woods lawn sound system with EAW amplification and redundant audio paths. Explore the design’s focus on sound clarity and reliability.
 5-Axis CNC Tonewood CarvingOct 23, 2026How workholding affects neck pocket repeatability in CNC luthieryImprove CNC luthiery repeatability with smarter workholding. Learn how datums, support, clamping, and vacuum control help deliver consistent neck pockets and reduce rework.
 Digital Live Mixing ConsolesOct 23, 2026Old World Village Upgrades Audio with Allen & Heath AHM32 and DX88Old World Village upgrades audio with Allen & Heath AHM32 and DX88. Explore how the system supports live sound and zoned audio for its outdoor stage and Biergarten.
 Floating Soundproof FloorsOct 22, 2026How to choose studio soundproofing materials for floating floorsChoose studio soundproofing materials for floating floors with confidence. Compare loads, resonance, acoustic tests, and installation details to avoid costly mistakes and improve isolation.
 Feedback Suppression DSPOct 22, 2026Pine DSP Launches Blox Rack Modular Effects Rack PluginDiscover Pine DSP Blox Rack, a modular effects rack plugin with EQ, compression, reverb and more. Explore its modulation tools and what to check before adding it to your DAW workflow.